
Oct 21, 2026
Five things we learnt giving Fable 5.1 an Agent Wallet and 100 USDC
An experiment with real trades, paid market data and a trading journal.

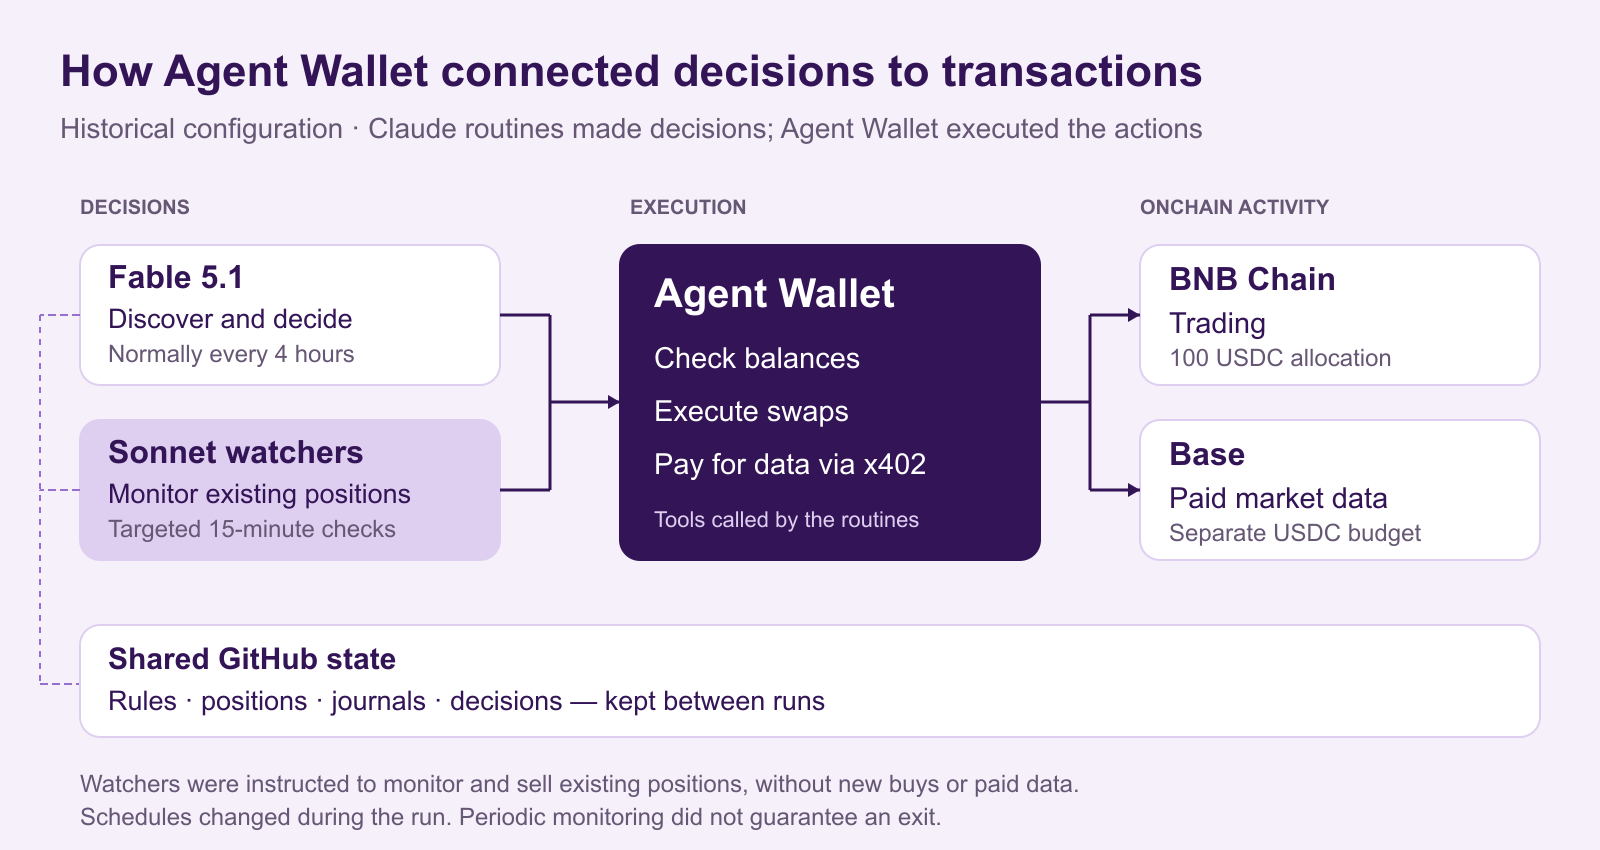
We gave Fable 5.1 a Finance District Agent Wallet and 100 USDC to trade on BNB Chain from September 17 to October 2, 2026. Claude Code routines ran the experiment in the cloud, while GitHub kept the rules, positions and journals between runs. We set the trading rules and adjusted them throughout based on the insights and performance.
Agent Wallet let the agent check balances, trade assets and pay for market data. Fable chose trades; separate Sonnet routines watched positions and handled exits. Data payments used USDC on Base, with gas and data funded separately from the trading allocation.
Its best trade happened at 12:41am on September 28, Fable bought 10 USDC of RHEA. A Sonnet watcher sold half at 4:06am and the remaining half at 9:22am. The full position returned 13.57 USDC, a 35.7% gain before operating costs. You can view the buy, first sale and second sale on BscScan.
As expected, not every trade made money. The experiment also exposed unnecessary data spending and a flaw in our profit-taking rules.
1. Give trading and monitoring different schedules
The portfolio held BTCB, ETH and BNB alongside cash and smaller cap alt tokens. Before entering a trade, the agent checked moving averages, RSI, volume, liquidity and token security, then recorded its exit conditions: a stop-loss level and a profit-taking target. The main Fable trader initially checked markets every four hours, but after a token’s price fell sharply between checks, we added Sonnet watchers every 15 minutes. Their job was narrower: check existing positions and apply exit rules, basically to follow instructions without opening new positions or buying data. These were periodic checks followed by attempted swaps, so they could not guarantee an exit price.
2. Check whether paid data can change a decision
To find candidates, the main trader bought data from Nansen and CoinGecko one API request at a time. Agent Wallet handled these x402 payments in USDC on Base.
| Input | What it added | Cost per request |
|---|---|---|
| Nansen | Smart Money net flows and tracked-wallet counts | 0.05 USDC |
| CoinGecko | Trending pools, trading activity, liquidity and pool age | 0.01 USDC |
| Free sources | Prices and candles for entry checks and monitoring | No per-request payment in this setup |
On September 21, Nansen data surfaced RHEA, but the agent passed on the initial spike with RSI at 81. It bought later that day after RSI fell to 55 and the price held above its moving averages. For the separate September 28 RHEA trade, CoinGecko supplied the candidate, which the agent checked against free candle data before buying.
We also found a run that bought both data feeds at 0.06 USDC cost even though all three alt token slots were already full. We changed the instructions to check for an available slot, enough cash and permission to enter before spending on discovery. The watchers already used free price data so no cost optimisation needed there.
3. Make exit rules remember previous sales
Our profit-taking plan was to sell half, move the remaining stop threshold to the entry price and let the rest run. But an early version could sell the remaining half on the next check because the original trailing condition was still true, see RHEA September 25 example below.
| Selected entry | What happened | Outcome before operating costs |
|---|---|---|
| RHEA, September 25 | Sold 50% at 19:37 and remaining 50% at 19:52 | The 15-minute gap exposed the exit-rule problem |
| RHEA, September 28 | Bought at 00:41; sold 50% at 04:06 and remaining 50% at 09:22 | 10 USDC spent → 13.57 USDC received; +35.7% |
| NEAR, September 21–22 | Main trader exited after its moving-average condition failed | −5.37% on the portion sold; a small balance remained |
The fix was to record the price peak when it sold half. Another trailing exit then required a new higher peak; until then, the remaining position used its entry-price stop threshold. We made this change after the September 28 RHEA trade, so that winner was not a test of the fix. After the fix, CAP showed the intended sequence: half sold on October 1, with the next sale about 31 hours later, after a new peak and pullback. The remaining position had survived subsequent watcher checks.
GitHub stored this updated position state for the next watcher to read. Agent Wallet executed the swaps when a routine called for an exit.
4. Review rejected candidates as well as trades
The agent also reviewed the trades it never made. It logged why it rejected candidates and used follow-up prices at 24 and 72 hours to look for missed opportunities. If a token rose after being rejected, the review could revisit the decision and ask whether the rule needed adjusting.
The reviewer also checked prices 6 and 24 hours after sales to assess whether it had exited too early. It saved reusable notes in GitHub for later runs, including a warning against favouring a candidate just because its one-hour Nansen flow was positive. The instructions limited these notes to choosing between candidates that already passed the trading and security rules.
One weekly review found that 5 of 15 liquidity rejections had missed a more liquid pool for the same token. It proposed a second lookup on GeckoTerminal before rejecting a candidate based on DexScreener. We adopted that change the next day.
The reviews also flagged sharp rises among tokens rejected by the chart filter. Limited parameter changes were allowed, with larger changes coming back to us, but neither weekly review found enough evidence to change a parameter. The process helped us investigate missed trades and improve the liquidity lookup; better trading performance remains unproven.
5. Running costs exceeded the recorded increase
This experiment started with just 100 USDC. The roughly US$5.71 in data and estimated gas costs depended mainly on requests, transactions and fee levels, rather than the size of the trading pot. If those costs stayed the same, they would represent about 0.57% of a 1,000-USDC account or 0.057% of a 10,000-USDC account over the same period.
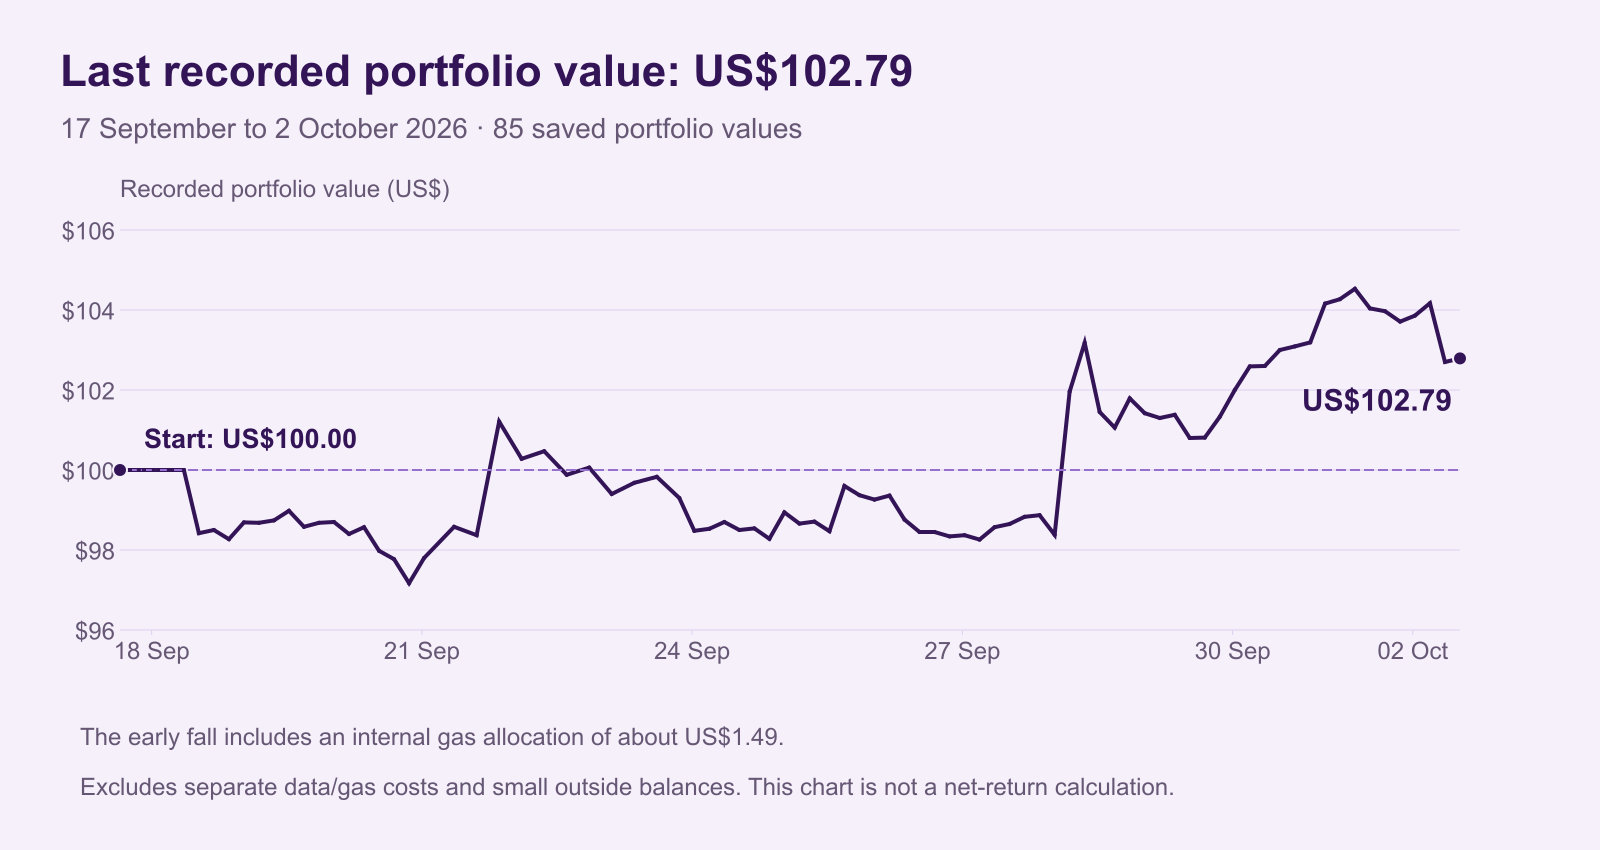
On our small account, though, they exceeded the recorded increase. By October 2, the portfolio was worth US$102.79, up US$2.79, which did not cover the data and gas bill.
| Component | Result or cost |
|---|---|
| Recorded portfolio on October 2 | US$102.79, an increase of US$2.79 |
| Paid data | 5.08 USDC: 85 Nansen payments and 83 CoinGecko payments |
| Gas | Approximately US$0.63 |
| Claude | Shared subscription used for other work; no separate trading cost assigned |
Buying both feeds cost 0.06 USDC. The 5.08-USDC data bill was equivalent to about 85 pairs of requests.
We treated remaining positions as sold at their final logged prices, before sale costs. For transparency, the record excludes the gas reserve, including about US$1.49 transferred into it, and small residual balances, so this is not a complete net return.
What’s next
The next run needs complete asset and cost tracking, plus a buy-and-hold comparison from the start. We want to test whether paid discovery improves on free data, whether signals from public trader wallets selected in advance help, and whether simple code can take over routine price checks.
Inspect the experiment’s wallet on BNB Chain and its data payments on Base, or watch the setup video. To try your own experiment, explore Agent Wallet or join the Finance District community.
For the full trade ledger, portfolio charts and notes on how the figures were calculated, check out the experiment companion (PDF).
All trade times are GMT+8. Historical experiment, not investment advice or a promise of returns.

